
MCP-PostgreSQL-Ops
🐘 Give AI assistants full PostgreSQL DBA superpowers — 30+ tools for performance analysis, bloat detection, lock/deadlock monitoring, autovacuum & schema inspection. No extensions required. PG 12-18.
Documentation
MCP Server for PostgreSQL Operations and Monitoring









Architecture & Internal (DeepWiki)

Overview
MCP-PostgreSQL-Ops is a professional MCP server for PostgreSQL database operations, monitoring, and management. Supports PostgreSQL 12-18 with comprehensive database analysis, performance monitoring, and intelligent maintenance recommendations through natural language queries. Most features work independently, but advanced query analysis capabilities are enhanced when `pg_stat_statements` and (optionally) `pg_stat_monitor` extensions are installed.
Features
- ✅ Zero Configuration: Works with PostgreSQL 12-18 out-of-the-box with automatic version detection.
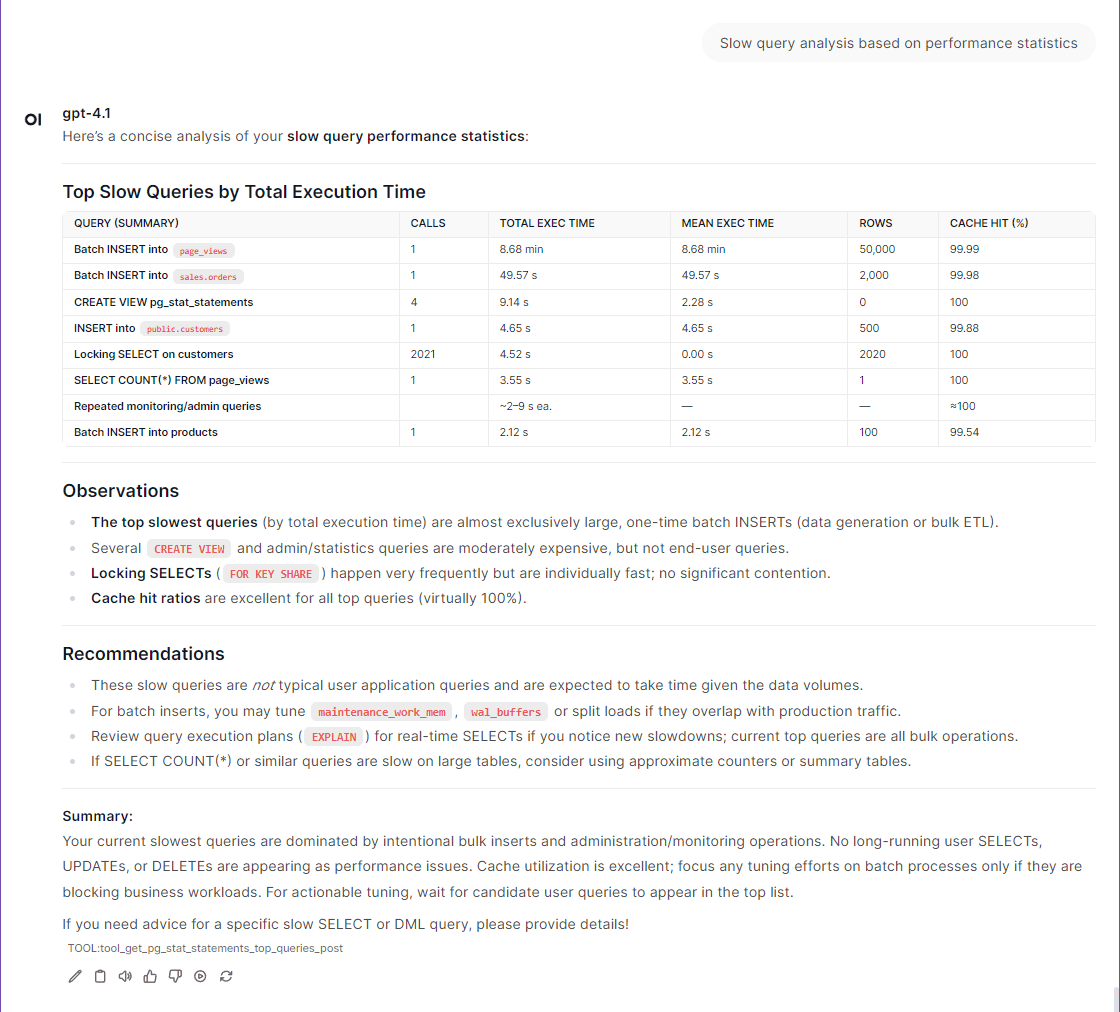
- ✅ Natural Language: Ask questions like "Show me slow queries" or "Analyze table bloat."
- ✅ Production Safe: Read-only operations, RDS/Aurora compatible with regular user permissions.
- ✅ Extension Enhanced: Optional `pg_stat_statements` and `pg_stat_monitor` for advanced query analytics.
- ✅ Comprehensive Database Monitoring: Performance analysis, bloat detection, and maintenance recommendations.
- ✅ Smart Query Analysis: Slow query identification with `pg_stat_statements` and `pg_stat_monitor` integration.
- ✅ Schema & Relationship Discovery: Database structure exploration with detailed relationship mapping.
- ✅ VACUUM & Autovacuum Intelligence: Real-time maintenance monitoring and effectiveness analysis.
- ✅ Multi-Database Operations: Seamless cross-database analysis and monitoring.
- ✅ Enterprise-Ready: Safe read-only operations with RDS/Aurora compatibility.
- ✅ Developer-Friendly: Simple codebase for easy customization and tool extension.
🔧 Advanced Capabilities
- Version-aware I/O statistics (enhanced on PostgreSQL 16+, byte columns on PG 18+).
- Real-time connection and lock monitoring.
- Background process and checkpoint analysis.
- Replication status and WAL monitoring.
- Database capacity and bloat analysis.
- Wait event catalog with descriptions (PG 17+).
- WAL summarizer monitoring for incremental backups (PG 17+).
- Async I/O subsystem monitoring (PG 18+).
- Per-backend I/O and WAL statistics (PG 18+).
Tool Usage Examples
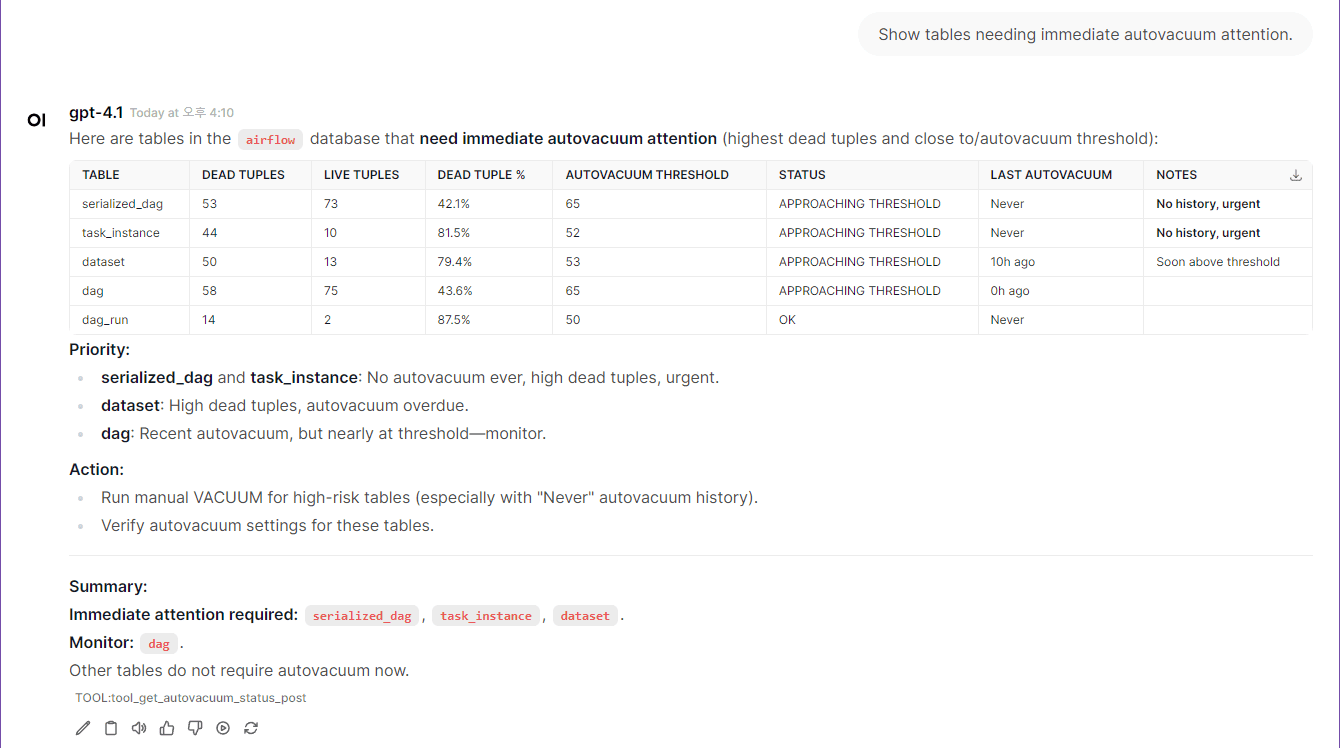
📸 **More Examples with Screenshots →**
⭐ Quickstart (5 minutes)
> Note: The `postgresql` container included in `docker-compose.yml` is intended for quickstart testing purposes only. You can connect to your own PostgreSQL instance by adjusting the environment variables as needed.
> If you want to use your own PostgreSQL instance instead of the built-in test container:
> - Update the target PostgreSQL connection information in your `.env` file (see POSTGRES_HOST, POSTGRES_PORT, POSTGRES_USER, POSTGRES_PASSWORD, POSTGRES_DB).
> - In `docker-compose.yml`, comment out (disable) the `postgres` and `postgres-init-extensions` containers to avoid starting the built-in test database.
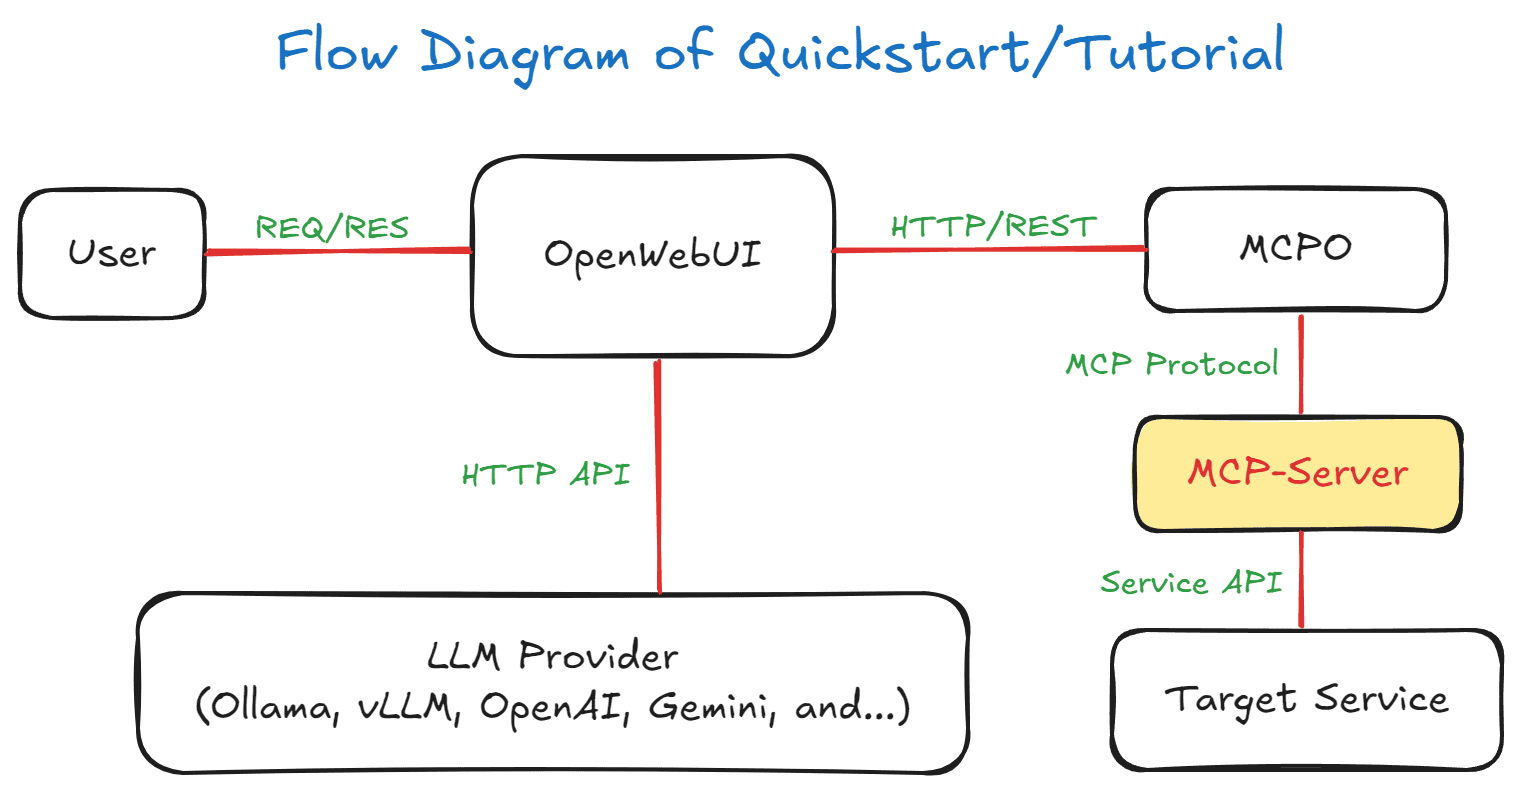
Flow Diagram of Quickstart/Tutorial
1. Environment Setup
> Note: While superuser privileges provide access to all databases and system information, the MCP server also works with regular user permissions for basic monitoring tasks.
git clone https://github.com/call518/MCP-PostgreSQL-Ops.git
cd MCP-PostgreSQL-Ops

### Check and modify .env file
cp .env.example .env
vim .env### No need to modify defaults, but if using your own PostgreSQL server, edit below:
POSTGRES_HOST=host.docker.internal
POSTGRES_PORT=15432 # External port for host access (mapped to internal 5432)
POSTGRES_USER=postgres
POSTGRES_PASSWORD=changeme!@34
POSTGRES_DB=ecommerce # Default connection DB. Superusers can access all DBs.> Note: `PGDATA=/data/db` is preconfigured for the Percona PostgreSQL Docker image, which requires this specific path for proper write permissions.
2. Start Demo Containers
# Start all containers including built-in PostgreSQL for testing
docker-compose up -d

# Alternative: If using your own PostgreSQL instance
# Comment out postgres and postgres-init-extensions services in docker-compose.yml
# Then use the custom configuration:
# docker-compose -f docker-compose.custom-db.yml up -d
> ⏰ Wait for Environment Setup: The initial environment setup takes a few minutes as containers are started in sequence:
> 1. PostgreSQL container starts first with database initialization
> 2. PostgreSQL Extensions container installs extensions and creates comprehensive test data (~83K records)
> 3. MCP Server and MCPO Proxy containers start after PostgreSQL is ready
> 4. OpenWebUI container starts last and may take additional time to load the web interface
>
> 💡 Tip: Wait 2-3 minutes after running `docker-compose up -d` before accessing OpenWebUI to ensure all services are fully initialized.
🔍 Check Container Status (Optional):
# Monitor container startup progress
docker-compose logs -f

# Check if all containers are running
docker-compose ps

# Verify PostgreSQL is ready
docker-compose logs postgres | grep "ready to accept connections"
3. Access to OpenWebUI
http://localhost:3003/
- The list of MCP tool features provided by `swagger` can be found in the MCPO API Docs URL.
- e.g: `http://localhost:8003/docs`
4. Registering the Tool in OpenWebUI
> 📌 Note: Web-UI configuration instructions are based on OpenWebUI v0.6.22. Menu locations and settings may differ in newer versions.
1. logging in to OpenWebUI with an admin account
1. go to "Settings" → "Tools" from the top menu.
1. Enter the `postgresql-ops` Tool address (e.g., `http://localhost:8003/postgresql-ops`) to connect MCP Tools.
1. Setup Ollama or OpenAI.
5. Complete!
Congratulations! Your MCP PostgreSQL Operations server is now ready for use. You can start exploring your databases with natural language queries.
🚀 Try These Example Queries:
- "Show me the current active connections"
- "What are the slowest queries in the system?"
- "Analyze table bloat across all databases"
- "Show me database size information"
- "What tables need VACUUM maintenance?"
📖 Next Steps:
- Browse the **Example Queries section** below for more query examples
- Check out **Tool Usage Examples with Screenshots** for visual guides
- Explore the **Tool Compatibility Matrix** to understand available features
(NOTE) Sample Test Data Overview
The `create-test-data.sql` script is executed by the `postgres-init-extensions` container (defined in docker-compose.yml) on first startup, automatically generating comprehensive test databases for MCP tool testing:
| Database | Purpose | Schema & Tables | Scale |
|---|---|---|---|
| ecommerce | E-commerce system | public: categories, products, customers, orders, order_items | 10 categories, 500 products, 100 customers, 200 orders, 400 order items |
| analytics | Analytics & reporting | public: page_views, sales_summary | 1,000 page views, 30 sales summaries |
| inventory | Warehouse management | public: suppliers, inventory_items, purchase_orders | 10 suppliers, 100 items, 50 purchase orders |
| hr_system | HR management | public: departments, employees, payroll | 5 departments, 50 employees, 150 payroll records |
Test users created: `app_readonly`, `app_readwrite`, `analytics_user`, `backup_user`
Optimized for testing: Intentional table bloat, various indexes (used/unused), time-series data, complex relationships
Tool Compatibility Matrix
> Automatic Adaptation: All tools work transparently across supported versions - no configuration needed!
🟢 Extension-Independent Tools (No Extensions Required)
| Tool Name | Extensions Required | PG 12 | PG 13 | PG 14 | PG 15 | PG 16 | PG 17 | PG 18 | System Views/Tables Used |
|---|---|---|---|---|---|---|---|---|---|
| `get_server_info` | ❌ None | ✅ | ✅ | ✅ | ✅ | ✅ | ✅ | ✅ | `version()`, `pg_extension` |
| `get_active_connections` | ❌ None | ✅ | ✅ | ✅ | ✅ | ✅ | ✅ | ✅ | `pg_stat_activity` |
| `get_postgresql_config` | ❌ None | ✅ | ✅ | ✅ | ✅ | ✅ | ✅ | ✅ | `pg_settings` |
| `get_database_list` | ❌ None | ✅ | ✅ | ✅ | ✅ | ✅ | ✅ | ✅ | `pg_database` |
| `get_table_list` | ❌ None | ✅ | ✅ | ✅ | ✅ | ✅ | ✅ | ✅ | `information_schema.tables` |
| `get_table_schema_info` | ❌ None | ✅ | ✅ | ✅ | ✅ | ✅ | ✅ | ✅ | `information_schema.*`, `pg_indexes` |
| `get_database_schema_info` | ❌ None | ✅ | ✅ | ✅ | ✅ | ✅ | ✅ | ✅ | `pg_namespace`, `pg_class`, `pg_proc` |
| `get_table_relationships` | ❌ None | ✅ | ✅ | ✅ | ✅ | ✅ | ✅ | ✅ | `information_schema.*` (constraints) |
| `get_user_list` | ❌ None | ✅ | ✅ | ✅ | ✅ | ✅ | ✅ | ✅ | `pg_user`, `pg_roles` |
| `get_index_usage_stats` | ❌ None | ✅ | ✅ | ✅ | ✅ | ✅ | ✅ | ✅ | `pg_stat_user_indexes` |
| `get_database_size_info` | ❌ None | ✅ | ✅ | ✅ | ✅ | ✅ | ✅ | ✅ | `pg_database_size()` |
| `get_table_size_info` | ❌ None | ✅ | ✅ | ✅ | ✅ | ✅ | ✅ | ✅ | `pg_total_relation_size()` |
| `get_vacuum_analyze_stats` | ❌ None | ✅ | ✅ | ✅ | ✅ | ✅ | ✅ | ✅ Enhanced | `pg_stat_user_tables` |
| `get_current_database_info` | ❌ None | ✅ | ✅ | ✅ | ✅ | ✅ | ✅ | ✅ | `pg_database`, `current_database()` |
| `get_table_bloat_analysis` | ❌ None | ✅ | ✅ | ✅ | ✅ | ✅ | ✅ | ✅ | `pg_stat_user_tables` |
| `get_database_bloat_overview` | ❌ None | ✅ | ✅ | ✅ | ✅ | ✅ | ✅ | ✅ | `pg_stat_user_tables` |
| `get_autovacuum_status` | ❌ None | ✅ | ✅ | ✅ | ✅ | ✅ | ✅ | ✅ | `pg_stat_user_tables` |
| `get_autovacuum_activity` | ❌ None | ✅ | ✅ | ✅ | ✅ | ✅ | ✅ | ✅ | `pg_stat_user_tables` |
| `get_running_vacuum_operations` | ❌ None | ✅ | ✅ | ✅ | ✅ | ✅ | ✅ | ✅ | `pg_stat_activity` |
| `get_vacuum_effectiveness_analysis` | ❌ None | ✅ | ✅ | ✅ | ✅ | ✅ | ✅ | ✅ | `pg_stat_user_tables` |
| `get_lock_monitoring` | ❌ None | ✅ | ✅ | ✅ | ✅ | ✅ | ✅ | ✅ | `pg_locks`, `pg_stat_activity` |
| `get_wal_status` | ❌ None | ✅ | ✅ | ✅ | ✅ | ✅ | ✅ | ✅ | `pg_current_wal_lsn()` |
| `get_database_stats` | ❌ None | ✅ | ✅ | ✅ | ✅ | ✅ | ✅ | ✅ Enhanced | `pg_stat_database` |
| `get_table_io_stats` | ❌ None | ✅ | ✅ | ✅ | ✅ | ✅ | ✅ | ✅ | `pg_statio_user_tables` |
| `get_index_io_stats` | ❌ None | ✅ | ✅ | ✅ | ✅ | ✅ | ✅ | ✅ | `pg_statio_user_indexes` |
| `get_database_conflicts_stats` | ❌ None | ✅ | ✅ | ✅ | ✅ | ✅ | ✅ | ✅ | `pg_stat_database_conflicts` |
🚀 Version-Aware Tools (Auto-Adapting)
| Tool Name | Extensions Required | PG 12 | PG 13 | PG 14 | PG 15 | PG 16 | PG 17 | PG 18 | Special Features |
|---|---|---|---|---|---|---|---|---|---|
| `get_io_stats` | ❌ None | ✅ Basic | ✅ Basic | ✅ Basic | ✅ Basic | ✅ Enhanced | ✅ Enhanced | ✅ Enhanced | PG16+: `pg_stat_io` support; PG18+: byte columns |
| `get_bgwriter_stats` | ❌ None | ✅ | ✅ | ✅ | ✅ | ✅ | ✅ Special | ✅ Enhanced | PG17: Separate checkpointer stats; PG18+: `num_done`, `slru_written` |
| `get_replication_status` | ❌ None | ✅ Compatible | ✅ Enhanced | ✅ Enhanced | ✅ Enhanced | ✅ Enhanced | ✅ Enhanced | ✅ Enhanced | PG13+: `wal_status`, `safe_wal_size`; PG16+: enhanced WAL receiver; PG17+: `invalidation_reason`, `inactive_since` |
| `get_all_tables_stats` | ❌ None | ✅ Compatible | ✅ Enhanced | ✅ Enhanced | ✅ Enhanced | ✅ Enhanced | ✅ Enhanced | ✅ Enhanced | PG13+: `n_ins_since_vacuum` tracking for vacuum maintenance optimization |
| `get_user_functions_stats` | ⚙️ Config Required | ✅ | ✅ | ✅ | ✅ | ✅ | ✅ | ✅ | Requires `track_functions=pl` |
| `get_wait_events` | ❌ None | ✅ Fallback | ✅ Fallback | ✅ Fallback | ✅ Fallback | ✅ Fallback | ✅ Native | ✅ Native | PG17+: `pg_wait_events` catalog; PG12-16: fallback to `pg_stat_activity` current waits |
| `get_wal_summarizer_status` | ❌ None | ❌ | ❌ | ❌ | ❌ | ❌ | ✅ | ✅ | PG17+: WAL summarizer monitoring for incremental backups |
| `get_async_io_status` | ❌ None | ❌ | ❌ | ❌ | ❌ | ❌ | ❌ | ✅ | PG18+: `pg_aios` async I/O subsystem monitoring |
| `get_per_backend_io_stats` | ❌ None | ❌ | ❌ | ❌ | ❌ | ❌ | ❌ | ✅ | PG18+: Per-backend I/O and WAL statistics |
🟡 Extension-Dependent Tools (Extensions Required)
| Tool Name | Required Extension | PG 12 | PG 13 | PG 14 | PG 15 | PG 16 | PG 17 | PG 18 | Notes |
|---|---|---|---|---|---|---|---|---|---|
| `get_pg_stat_statements_top_queries` | `pg_stat_statements` | ✅ Compatible | ✅ Enhanced | ✅ Enhanced | ✅ Enhanced | ✅ Enhanced | ✅ Enhanced | ✅ Enhanced | PG12: `total_time` → `total_exec_time`; PG13+: native `total_exec_time`; PG17+: `stats_since` |
| `get_pg_stat_monitor_recent_queries` | `pg_stat_monitor` | ✅ Compatible | ✅ Enhanced | ✅ Enhanced | ✅ Enhanced | ✅ Enhanced | ✅ Enhanced | ✅ Enhanced | PG12: `total_time` → `total_exec_time`; PG13+: native `total_exec_time` |
🆕 Version-Specific Features
PostgreSQL 17
- `pg_wait_events` view: Native wait event catalog with descriptions (used by `get_wait_events`)
- WAL summarizer: Monitoring for incremental backup support (used by `get_wal_summarizer_status`)
- Replication slot enhancements: `invalidation_reason` and `inactive_since` columns (used by `get_replication_status`)
- `pg_stat_statements` `stats_since`: Track when statistics were last reset (used by `get_pg_stat_statements_top_queries`)
- VACUUM progress: Index vacuum tracking in progress views (future enhancement for `get_running_vacuum_operations`)
PostgreSQL 18
- `pg_aios` view: Async I/O subsystem monitoring (used by `get_async_io_status`)
- Per-backend I/O stats: Individual backend I/O and WAL statistics (used by `get_per_backend_io_stats`)
- VACUUM/ANALYZE time columns: `total_vacuum_time`, `total_autovacuum_time`, `total_analyze_time`, `total_autoanalyze_time` cumulative timing (used by `get_vacuum_analyze_stats`)
- `pg_stat_io` byte columns: `read_bytes`, `write_bytes`, `extend_bytes` (used by `get_io_stats`)
- Parallel worker stats: `parallel_workers_launched`, `parallel_workers_to_launch` (used by `get_database_stats`)
- Checkpointer enhancements: `num_done`, `slru_written` columns (used by `get_bgwriter_stats`)
Usage Examples
Claude Desktop Integration
(Recommended) Add to your Claude Desktop configuration file:
{
  "mcpServers": {
    "mcp-postgresql-ops": {
      "command": "uvx",
      "args": ["--python", "3.12", "mcp-postgresql-ops"],
      "env": {
        "POSTGRES_HOST": "127.0.0.1",
        "POSTGRES_PORT": "15432",
        "POSTGRES_USER": "postgres",
        "POSTGRES_PASSWORD": "changeme!@34",
        "POSTGRES_DB": "ecommerce"
      }
    }
  }
}
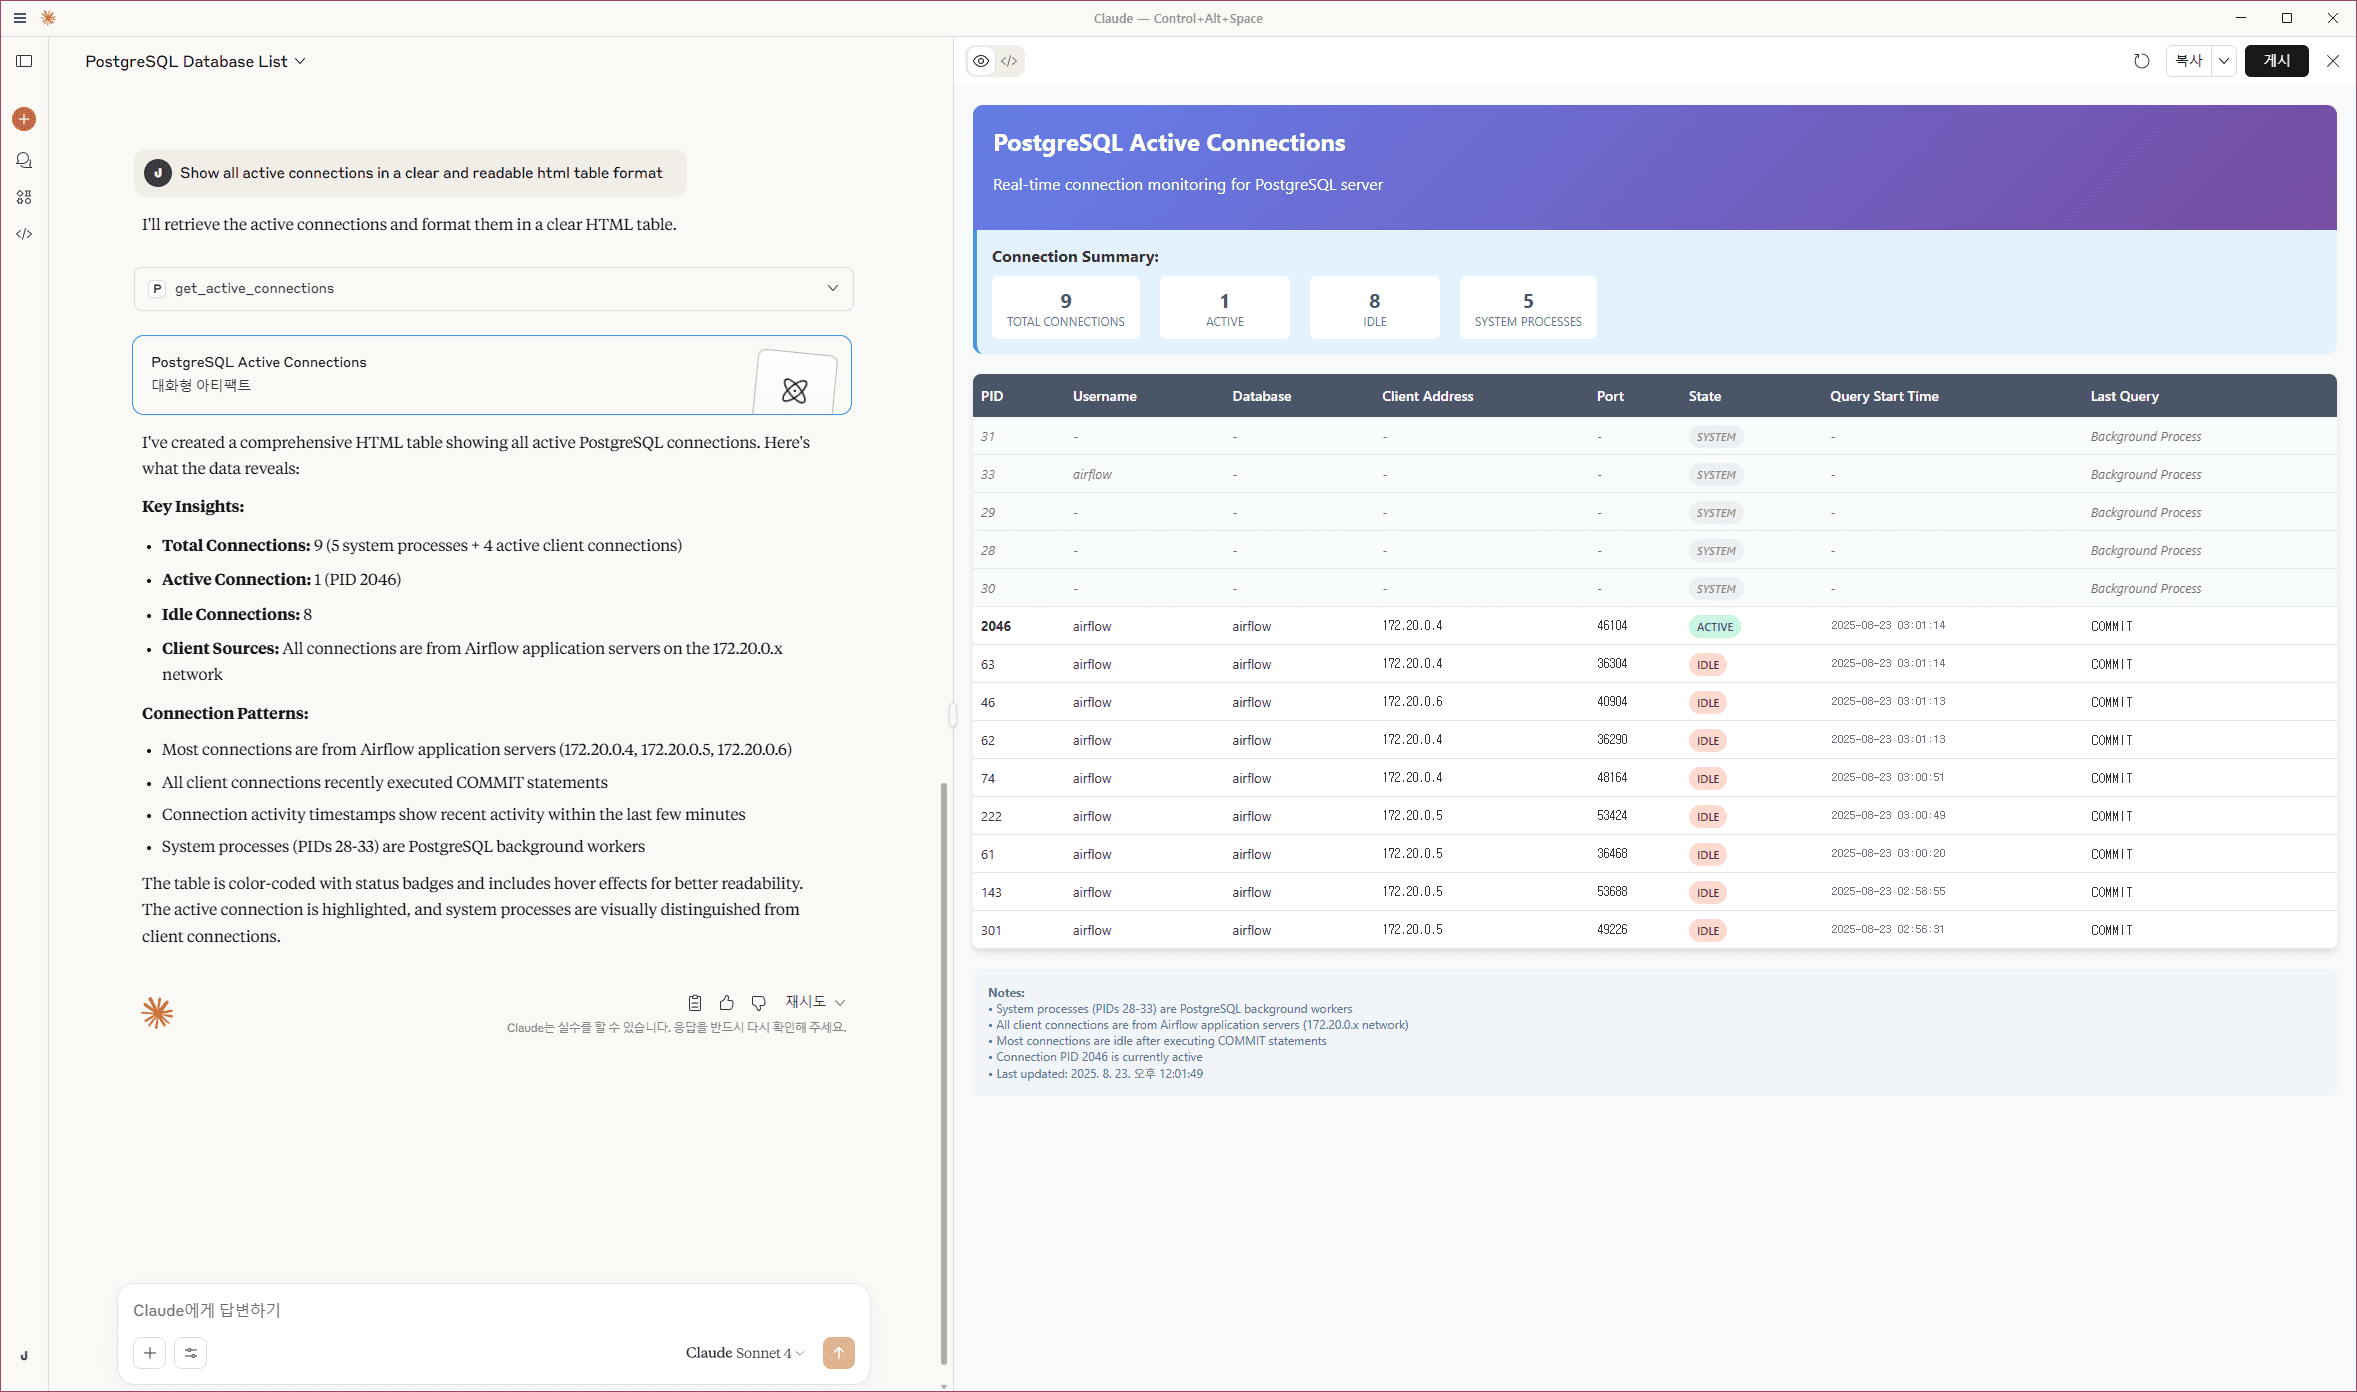
"Show all active connections in a clear and readable html table format."
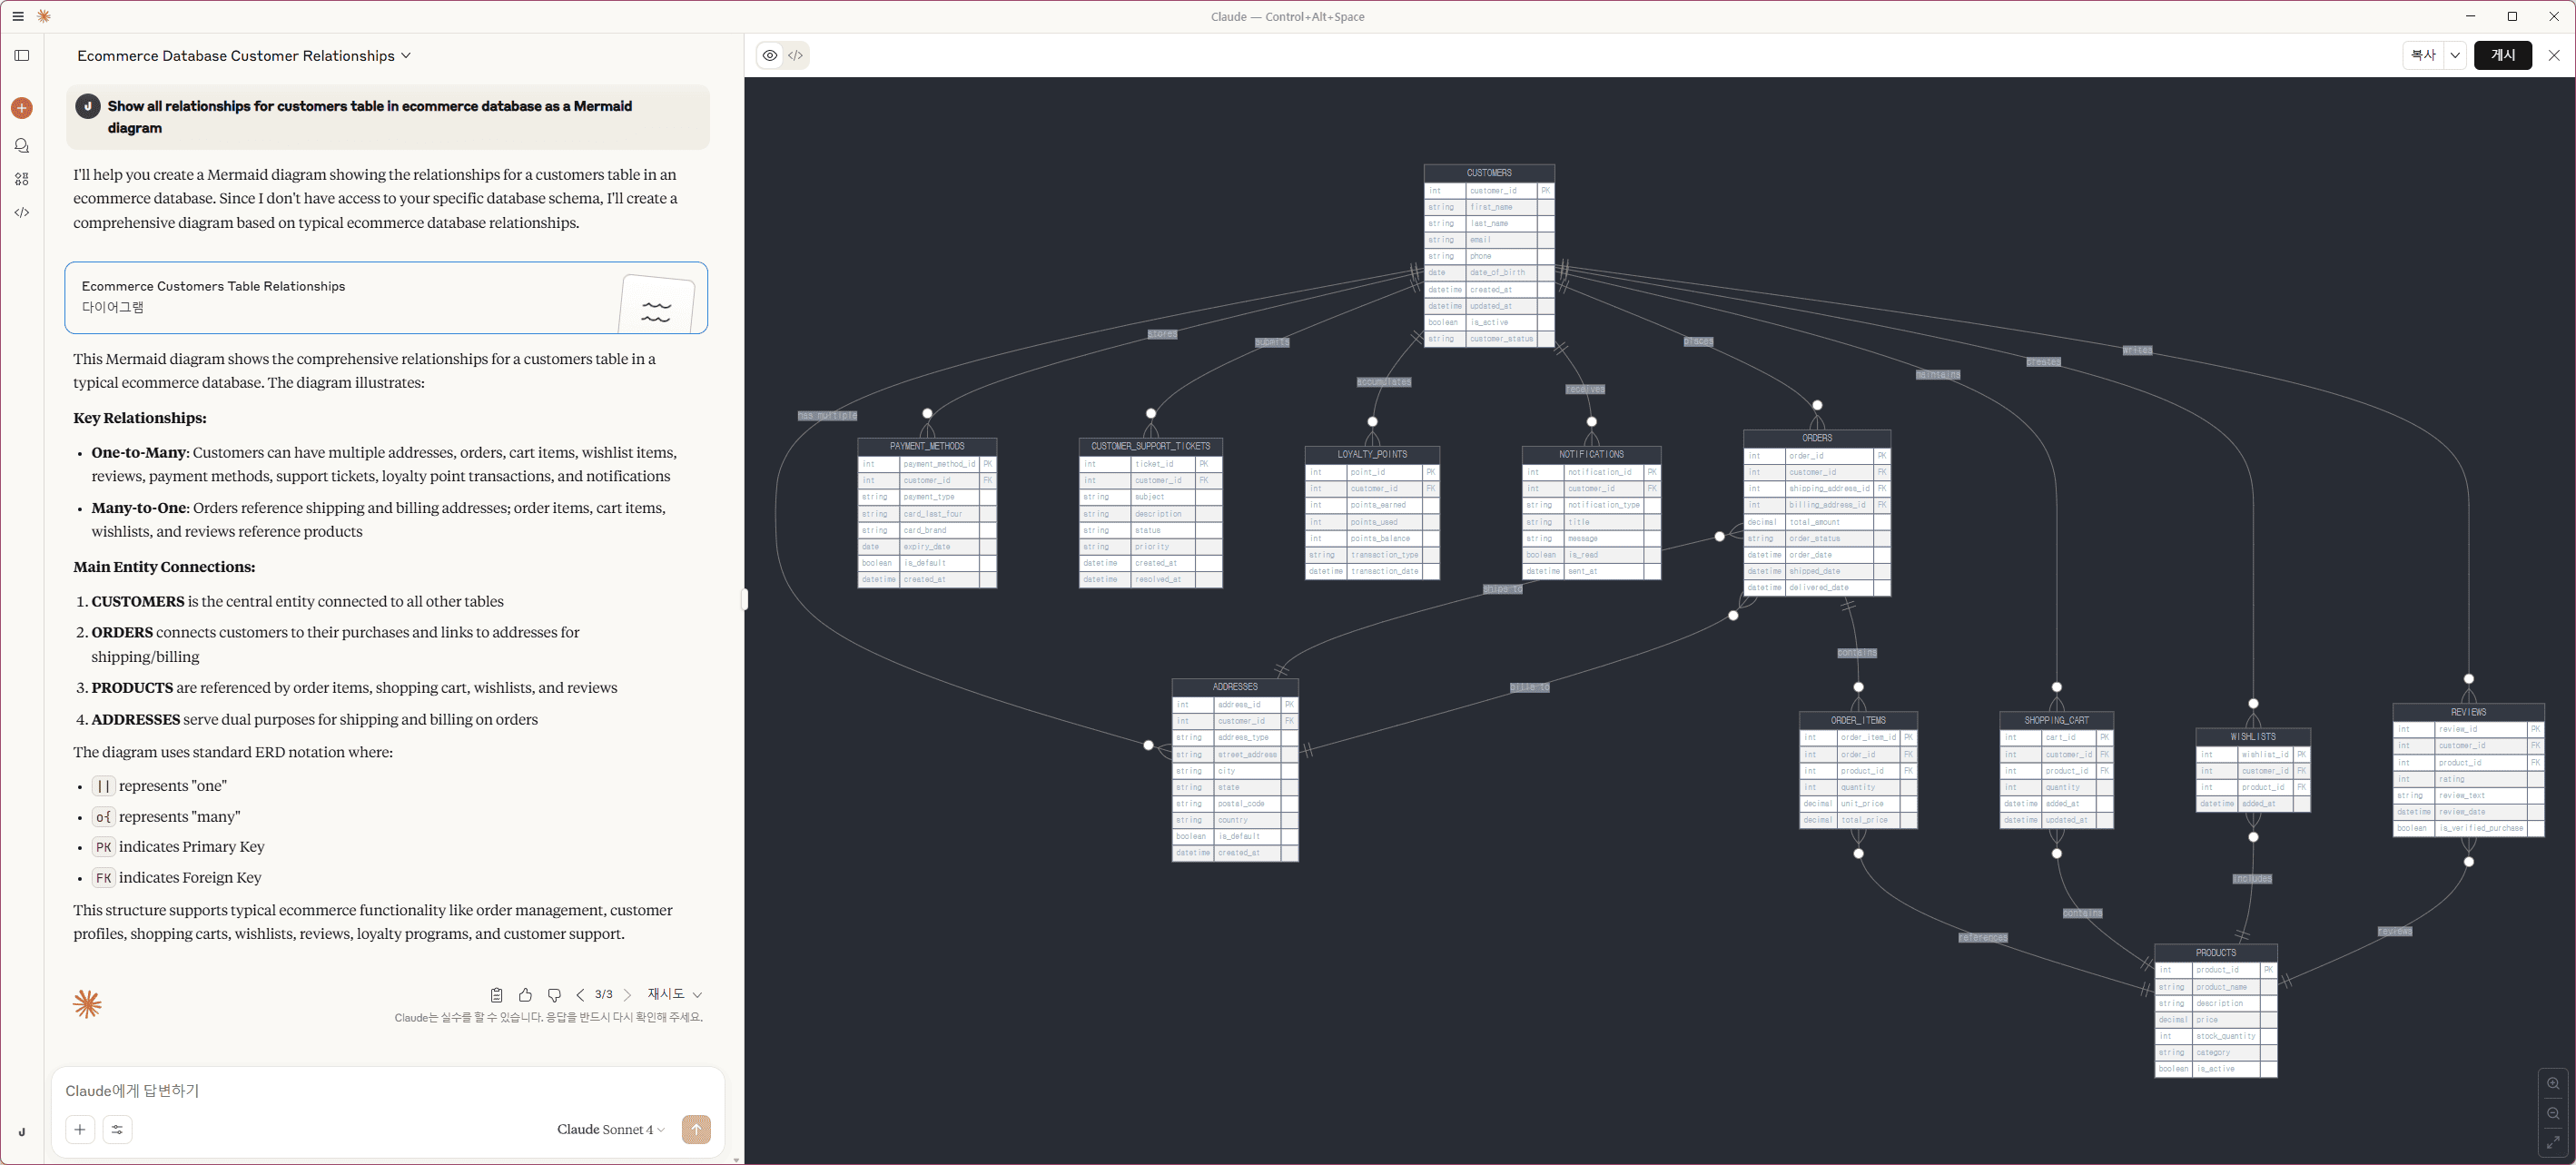
"Show all relationships for customers table in ecommerce database as a Mermaid diagram."
Installation
From PyPI (Recommended)
# Install the package
pip install mcp-postgresql-ops

# Or with uv (faster)
uv add mcp-postgresql-ops

# Verify installation
mcp-postgresql-ops --help
From Source
# Clone the repository
git clone https://github.com/call518/MCP-PostgreSQL-Ops.git
cd MCP-PostgreSQL-Ops

# Install with uv (recommended)
uv sync
uv run mcp-postgresql-ops --help

# Or with pip
pip install -e .
mcp-postgresql-ops --help
MCP Configuration
Claude Desktop Configuration
(Optional) Run with Local Source:
{
  "mcpServers": {
    "mcp-postgresql-ops": {
      "command": "uv",
      "args": ["run", "python", "-m", "mcp_postgresql_ops"],
      "env": {
        "POSTGRES_HOST": "127.0.0.1",
        "POSTGRES_PORT": "15432",
        "POSTGRES_USER": "postgres",
        "POSTGRES_PASSWORD": "changeme!@34",
        "POSTGRES_DB": "ecommerce"
      }
    }
  }
}
Run MCP-Server as Standalon
/w Pypi and uvx (Recommended)
# Stdio mode
uvx --python 3.12 mcp-postgresql-ops \
  --type stdio

# HTTP mode
uvx --python 3.12 mcp-postgresql-ops
  --type streamable-http \
  --host 127.0.0.1 \
  --port 8000 \
  --log-level DEBUG
(Option) Configure Multiple PostgreSQL Instances
{
  "mcpServers": {
    "Postgresql-A": {
      "command": "uvx",
      "args": ["--python", "3.12", "mcp-postgresql-ops"],
      "env": {
        "POSTGRES_HOST": "a.foo.com",
        "POSTGRES_PORT": "5432",
        "POSTGRES_USER": "postgres",
        "POSTGRES_PASSWORD": "postgres",
        "POSTGRES_DB": "postgres"
      }
    },
    "Postgresql-B": {
      "command": "uvx",
      "args": ["--python", "3.12", "mcp-postgresql-ops"],
      "env": {
        "POSTGRES_HOST": "b.bar.com",
        "POSTGRES_PORT": "5432",
        "POSTGRES_USER": "postgres",
        "POSTGRES_PASSWORD": "postgres",
        "POSTGRES_DB": "postgres"
      }
    }
  }
}
/w Local Source
# Method 1: Module execution (for development, requires PYTHONPATH)
PYTHONPATH=/path/to/MCP-PostgreSQL-Ops/src
python -m mcp_postgresql_ops \
  --type stdio

# Method 2: Direct script (after uv installation in project directory)
uv run mcp-postgresql-ops \
  --type stdio

# Method 3: Installed package script (after pip/uv install)
mcp-postgresql-ops \
  --type stdio

# HTTP mode examples:
# Development mode
PYTHONPATH=/path/to/MCP-PostgreSQL-Ops/src
python -m mcp_postgresql_ops \
  --type streamable-http \
  --host 127.0.0.1 \
  --port 8000 \
  --log-level DEBUG

# Production mode (after installation)
mcp-postgresql-ops \
  --type streamable-http \
  --host 127.0.0.1 \
  --port 8000 \
  --log-level DEBUG
CLI Arguments
- `--type`: Transport type (`stdio` or `streamable-http`) - Default: `stdio`
- `--host`: Host address for HTTP transport - Default: `127.0.0.1`
- `--port`: Port number for HTTP transport - Default: `8000`
- `--auth-enable`: Enable Bearer token authentication for streamable-http mode - Default: `false`
- `--secret-key`: Secret key for Bearer token authentication (required when auth enabled)
- `--log-level`: Logging level (DEBUG, INFO, WARNING, ERROR, CRITICAL) - Default: `INFO`
Environment Variables
| Variable | Description | Default | Project Default |
|---|---|---|---|
| `PYTHONPATH` | Python module search path (only needed for development mode) | - | `/app/src` |
| `MCP_LOG_LEVEL` | Server logging verbosity (DEBUG, INFO, WARNING, ERROR) | `INFO` | `INFO` |
| `FASTMCP_TYPE` | MCP transport protocol (stdio for CLI, streamable-http for web) | `stdio` | `streamable-http` |
| `FASTMCP_HOST` | HTTP server bind address (0.0.0.0 for all interfaces) | `127.0.0.1` | `0.0.0.0` |
| `FASTMCP_PORT` | HTTP server port for MCP communication | `8000` | `8000` |
| `REMOTE_AUTH_ENABLE` | Enable Bearer token authentication for streamable-http mode (Default: `false` if undefined/null/empty) | `false` | `false` |
| `REMOTE_SECRET_KEY` | Secret key for Bearer token authentication (required when auth enabled) | - | `your-secret-key-here` |
| `PGSQL_VERSION` | PostgreSQL major version for Docker image selection | `17` | `17` |
| `PGDATA` | PostgreSQL data directory inside Docker container (Do not modify) | `/var/lib/postgresql/data` | `/data/db` |
| `POSTGRES_HOST` | PostgreSQL server hostname or IP address | `127.0.0.1` | `host.docker.internal` |
| `POSTGRES_PORT` | PostgreSQL server port number | `5432` | `15432` |
| `POSTGRES_USER` | PostgreSQL connection username (needs read permissions) | `postgres` | `postgres` |
| `POSTGRES_PASSWORD` | PostgreSQL user password (supports special characters) | `changeme!@34` | `changeme!@34` |
| `POSTGRES_DB` | Default database name for connections | `testdb` | `ecommerce` |
| `POSTGRES_MAX_CONNECTIONS` | PostgreSQL max_connections configuration parameter | `200` | `200` |
| `DOCKER_EXTERNAL_PORT_OPENWEBUI` | Host port mapping for Open WebUI container | `8080` | `3003` |
| `DOCKER_EXTERNAL_PORT_MCP_SERVER` | Host port mapping for MCP server container | `8080` | `18003` |
| `DOCKER_EXTERNAL_PORT_MCPO_PROXY` | Host port mapping for MCPO proxy container | `8000` | `8003` |
| `DOCKER_INTERNAL_PORT_POSTGRESQL` | PostgreSQL container internal port | `5432` | `5432` |
Note: `POSTGRES_DB` serves as the default target database for operations when no specific database is specified. In Docker environments, if set to a non-default name, this database will be automatically created during initial PostgreSQL startup.
Port Configuration: The built-in PostgreSQL container uses port mapping `15432:5432` where:
- `POSTGRES_PORT=15432`: External port for host access and MCP server connections
- `DOCKER_INTERNAL_PORT_POSTGRESQL=5432`: Internal container port (PostgreSQL default)
- When using external PostgreSQL servers, set `POSTGRES_PORT` to match your server's actual port
Prerequisites
Required PostgreSQL Extensions
> For more details, see the ## Tool Compatibility Matrix
Note: Most MCP tools work without any PostgreSQL extensions. section below. Some advanced performance analysis tools require the following extensions:
-- Query performance statistics (required only for get_pg_stat_statements_top_queries)
CREATE EXTENSION IF NOT EXISTS pg_stat_statements;

-- Advanced monitoring (optional, used by get_pg_stat_monitor_recent_queries)
CREATE EXTENSION IF NOT EXISTS pg_stat_monitor;
Quick Setup: For new PostgreSQL installations, add to `postgresql.conf`:
shared_preload_libraries = 'pg_stat_statements'Then restart PostgreSQL and run the CREATE EXTENSION commands above.
- `pg_stat_statements` is required only for slow query analysis tools.
- `pg_stat_monitor` is optional and used for real-time query monitoring.
- All other tools work without these extensions.
Minimum Requirements
- PostgreSQL 12+ (tested with PostgreSQL 17 and 18)
- Python 3.12
- Network access to PostgreSQL server
- Read permissions on system catalogs
Required PostgreSQL Configuration
⚠️ Statistics Collection Settings:
Some MCP tools require specific PostgreSQL configuration parameters to collect statistics. Choose one of the following configuration methods:
Tools affected by these settings:
- get_user_functions_stats: Requires `track_functions = pl` or `track_functions = all`
- get_table_io_stats & get_index_io_stats: More accurate timing with `track_io_timing = on`
- get_database_stats: Enhanced I/O timing with `track_io_timing = on`
Verification:
After applying any method, verify the settings:
SELECT name, setting, context FROM pg_settings WHERE name IN ('track_activities', 'track_counts', 'track_io_timing', 'track_functions') ORDER BY name;

       name       | setting |  context
------------------+---------+-----------
 track_activities | on      | superuser
 track_counts     | on      | superuser
 track_functions  | pl      | superuser
 track_io_timing  | on      | superuser
(4 rows)
Method 1: postgresql.conf (Recommended for Self-Managed PostgreSQL)
Add the following to your `postgresql.conf`:
# Basic statistics collection (usually enabled by default)
track_activities = on
track_counts = on

# Required for function statistics tools
track_functions = pl    # Enables PL/pgSQL function statistics collection

# Optional but recommended for accurate I/O timing
track_io_timing = on    # Enables I/O timing statistics collection
Then restart PostgreSQL server.
Method 2: PostgreSQL Startup Parameters
For Docker or command-line PostgreSQL startup:
# Docker example
docker run -d \
  -e POSTGRES_PASSWORD=mypassword \
  postgres:17 \
  -c track_activities=on \
  -c track_counts=on \
  -c track_functions=pl \
  -c track_io_timing=on

# Direct postgres command
postgres -D /data \
  -c track_activities=on \
  -c track_counts=on \
  -c track_functions=pl \
  -c track_io_timing=on
Method 3: Dynamic Configuration (AWS RDS, Azure, GCP, Managed Services)
For managed PostgreSQL services where you cannot modify `postgresql.conf`, use SQL commands to change settings dynamically:
-- Enable basic statistics collection (usually enabled by default)
ALTER SYSTEM SET track_activities = 'on';
ALTER SYSTEM SET track_counts = 'on';

-- Enable function statistics collection (requires superuser privileges)
ALTER SYSTEM SET track_functions = 'pl';

-- Enable I/O timing statistics (optional but recommended)
ALTER SYSTEM SET track_io_timing = 'on';

-- Reload configuration without restart (run separately)
SELECT pg_reload_conf();
Alternative for session-level testing:
-- Set for current session only (temporary)
SET track_activities = 'on';
SET track_counts = 'on';
SET track_functions = 'pl';
SET track_io_timing = 'on';Note: When using command-line tools, run each SQL statement separately to avoid transaction block errors.
RDS/Aurora Compatibility
- This server is read-only and works with regular roles on RDS/Aurora. For advanced analysis enable pg_stat_statements; pg_stat_monitor is not available on managed engines.
- On RDS/Aurora, prefer DB Parameter Group over ALTER SYSTEM for persistent settings.
-- Verify preload setting
  SHOW shared_preload_libraries;

  -- Enable extension in target DB
  CREATE EXTENSION IF NOT EXISTS pg_stat_statements;

  -- Recommended visibility for monitoring
  GRANT pg_read_all_stats TO ;
Example Queries
🟢 Extension-Independent Tools (Always Available)
- get_server_info
- "Show PostgreSQL server version and extension status."
- "Check if pg_stat_statements is installed."
- get_active_connections
- "Show all active connections."
- "List current sessions with database and user."
- get_postgresql_config
- "Show all PostgreSQL configuration parameters."
- "Find all memory-related configuration settings."
- get_database_list
- "List all databases and their sizes."
- "Show database list with owner information."
- get_table_list
- "List all tables in the ecommerce database."
- "Show table sizes in the public schema."
- get_table_schema_info
- "Show detailed schema information for the customers table in ecommerce database."
- "Get column details and constraints for products table in ecommerce database."
- "Analyze table structure with indexes and foreign keys for orders table in sales schema of ecommerce database."
- "Show schema overview for all tables in public schema of inventory database."
- 📋 Features: Column types, constraints, indexes, foreign keys, table metadata
- ⚠️ Required: `database_name` parameter must be specified
- get_database_schema_info
- "Show all schemas in ecommerce database with their contents."
- "Get detailed information about sales schema in ecommerce database."
- "Analyze schema structure and permissions for inventory database."
- "Show schema overview with table counts and sizes for hr_system database."
- 📋 Features: Schema owners, permissions, object counts, sizes, contents
- ⚠️ Required: `database_name` parameter must be specified
- get_table_relationships
- "Show all relationships for customers table in ecommerce database."
- "Analyze foreign key relationships for orders table in sales schema of ecommerce database."
- "Get database-wide relationship overview for ecommerce database."
- "Find all tables that reference products table in ecommerce database."
- "Show cross-schema relationships in inventory database."
- 📋 Features: Foreign key relationships (inbound/outbound), cross-schema dependencies, constraint details
- ⚠️ Required: `database_name` parameter must be specified
- 💡 Usage: Leave `table_name` empty for database-wide relationship analysis
- get_user_list
- "List all database users and their roles."
- "Show user permissions for a specific database."
- get_index_usage_stats
- "Analyze index usage efficiency."
- "Find unused indexes in the current database."
- get_database_size_info
- "Show database capacity analysis."
- "Find the largest databases by size."
- get_table_size_info
- "Show table and index size analysis."
- "Find largest tables in a specific schema."
- get_vacuum_analyze_stats
- "Show recent VACUUM and ANALYZE operations."
- "List tables needing VACUUM."
- get_current_database_info
- "What database am I connected to?"
- "Show current database information and connection details."
- "Display database encoding, collation, and size information."
- 📋 Features: Database name, encoding, collation, size, connection limits
- 🔧 PostgreSQL 12-18: Fully compatible, no extensions required
- get_table_bloat_analysis
- "Analyze table bloat in the current database."
- "Show dead tuple ratios and bloat estimates for user_logs table pattern."
- "Find tables with high bloat that need VACUUM maintenance."
- "Analyze bloat in specific schema with minimum 100 dead tuples."
- 📋 Features: Dead tuple ratios, bloat size estimates, VACUUM recommendations, pattern filtering
- 🔧 PostgreSQL 12-18: Fully compatible, no extensions required
- 💡 Usage: Extension-Independent approach using pg_stat_user_tables
- get_database_bloat_overview
- "Show database-wide bloat summary by schema."
- "Get high-level view of storage efficiency across all schemas."
- "Identify schemas requiring maintenance attention."
- 📋 Features: Schema-level aggregation, total bloat estimates, maintenance status
- 🔧 PostgreSQL 12-18: Fully compatible, no extensions required
- get_autovacuum_status
- "Check autovacuum configuration and trigger conditions."
- "Show tables needing immediate autovacuum attention."
- "Analyze autovacuum threshold percentages for public schema."
- "Find tables approaching autovacuum trigger points."
- 📋 Features: Trigger threshold analysis, urgency classification, configuration status
- 🔧 PostgreSQL 12-18: Fully compatible, no extensions required
- 💡 Usage: Extension-Independent autovacuum monitoring using pg_stat_user_tables
- get_autovacuum_activity
- "Show autovacuum activity patterns for the last 48 hours."
- "Monitor autovacuum execution frequency and timing."
- "Find tables with irregular autovacuum patterns."
- "Analyze recent autovacuum and autoanalyze history."
- 📋 Features: Activity patterns, execution frequency, timing analysis
- 🔧 PostgreSQL 12-18: Fully compatible, no extensions required
- 💡 Usage: Historical autovacuum pattern analysis
- get_running_vacuum_operations
- "Show currently running VACUUM and ANALYZE operations."
- "Monitor active maintenance operations and their progress."
- "Check if any VACUUM operations are blocking queries."
- "Find long-running maintenance operations."
- 📋 Features: Real-time operation status, elapsed time, impact level, process details
- 🔧 PostgreSQL 12-18: Fully compatible, no extensions required
- 💡 Usage: Real-time maintenance monitoring using pg_stat_activity
- get_vacuum_effectiveness_analysis
- "Analyze VACUUM effectiveness and maintenance patterns."
- "Compare manual VACUUM vs autovacuum efficiency."
- "Find tables with suboptimal maintenance patterns."
- "Check VACUUM frequency vs table activity ratios."
- 📋 Features: Maintenance pattern analysis, effectiveness assessment, DML-to-VACUUM ratios
- 🔧 PostgreSQL 12-18: Fully compatible, no extensions required
- 💡 Usage: Strategic VACUUM analysis using existing statistics
- get_lock_monitoring
- "Show all current locks and blocked sessions."
- "Show only blocked sessions with granted=false filter."
- "Monitor locks by specific user with username filter."
- "Check exclusive locks with mode filter."
- get_wal_status
- "Show WAL status and archiving information."
- "Monitor WAL generation and current LSN position."
- get_replication_status
- "Check replication connections and lag status."
- "Monitor replication slots and WAL receiver status."
- get_database_stats
- "Show comprehensive database performance metrics."
- "Analyze transaction commit ratios and I/O statistics."
- "Monitor buffer cache hit ratios and temporary file usage."
- get_bgwriter_stats
- "Analyze checkpoint performance and timing."
- "Show me checkpoint performance."
- "Show background writer efficiency statistics."
- "Monitor buffer allocation and fsync patterns."
- get_user_functions_stats
- "Analyze user-defined function performance."
- "Show function call counts and execution times."
- "Identify performance bottlenecks in custom functions."
- ⚠️ Requires: `track_functions = pl` in postgresql.conf
- get_table_io_stats
- "Analyze table I/O performance and buffer hit ratios."
- "Identify tables with poor buffer cache performance."
- "Monitor TOAST table I/O statistics."
- 💡 Enhanced with: `track_io_timing = on` for accurate timing
- get_index_io_stats
- "Show index I/O performance and buffer efficiency."
- "Identify indexes causing excessive disk I/O."
- "Monitor index cache-friendliness patterns."
- 💡 Enhanced with: `track_io_timing = on` for accurate timing
- get_database_conflicts_stats
- "Check replication conflicts on standby servers."
- "Analyze conflict types and resolution statistics."
- "Monitor standby server query cancellation patterns."
- "Monitor WAL generation and current LSN position."
- get_replication_status
- "Check replication connections and lag status."
- "Monitor replication slots and WAL receiver status."
🚀 Version-Aware Tools (Auto-Adapting)
- get_io_stats (New!)
- "Show comprehensive I/O statistics." (PostgreSQL 16+ provides detailed breakdown)
- "Analyze I/O statistics."
- "Analyze buffer cache efficiency and I/O timing."
- "Monitor I/O patterns by backend type and context."
- 📈 PG16+: Full pg_stat_io with timing, backend types, and contexts
- 📊 PG12-15: Basic pg_statio_* fallback with buffer hit ratios
- get_bgwriter_stats (Enhanced!)
- "Show background writer and checkpoint performance."
- 📈 PG17+: Separate checkpointer and bgwriter statistics via `pg_stat_checkpointer`
- 📊 PG12-16: Combined bgwriter stats (includes checkpointer data)
- get_server_info (Enhanced!)
- "Show server version and compatibility features."
- "Check server compatibility."
- "Check what MCP tools are available on this PostgreSQL version."
- "Displays feature availability matrix and upgrade recommendations."
- get_all_tables_stats (Enhanced!)
- "Show comprehensive statistics for all tables." (version-compatible for PG12-18)
- "Include system tables with include_system=true parameter."
- "Analyze table access patterns and maintenance needs."
- 📈 PG13+: Tracks insertions since vacuum (`n_ins_since_vacuum`) for optimal maintenance scheduling
- 📊 PG12: Compatible mode with NULL for unsupported columns
- get_wait_events (New!)
- "Show wait event types and descriptions."
- "What wait events are available on this PostgreSQL version?"
- 📈 PG17+: Native `pg_wait_events` catalog with full descriptions
- 📊 PG12-16: Fallback to `pg_stat_activity` current waits grouped by type
- get_wal_summarizer_status (New! PG 17+)
- "Show WAL summarizer status for incremental backups."
- "Monitor WAL summarization progress."
- 📈 PG17+: WAL summarizer monitoring via `pg_get_wal_summarizer_state()`
- ❌ PG12-16: Not available (returns informational message)
- get_async_io_status (New! PG 18+)
- "Show async I/O subsystem status."
- "Monitor pg_aios for async I/O operations."
- 📈 PG18+: `pg_aios` view for async I/O monitoring
- ❌ PG12-17: Not available (returns informational message)
- get_per_backend_io_stats (New! PG 18+)
- "Show per-backend I/O and WAL statistics."
- "Analyze I/O patterns by individual backend process."
- 📈 PG18+: Per-backend I/O stats with WAL statistics
- ❌ PG12-17: Not available (returns informational message)
🟡 Extension-Dependent Tools
- get_pg_stat_statements_top_queries (Requires `pg_stat_statements`)
- "Show top 10 slowest queries."
- "Analyze slow queries in the inventory database."
- 📈 Version-Compatible: PG12 uses `total_time` → `total_exec_time` mapping; PG13+ uses native columns
- 💡 Cross-Version: Automatically adapts query structure for PostgreSQL 12-18 compatibility
- get_pg_stat_monitor_recent_queries (Optional, uses `pg_stat_monitor`)
- "Show recent queries in real time."
- "Monitor query activity for the last 5 minutes."
- 📈 Version-Compatible: PG12 uses `total_time` → `total_exec_time` mapping; PG13+ uses native columns
- 💡 Cross-Version: Automatically adapts query structure for PostgreSQL 12-18 compatibility
💡 Pro Tip: All tools support multi-database operations using the `database_name` parameter. This allows PostgreSQL superusers to analyze and monitor multiple databases from a single MCP server instance.
Troubleshooting
Connection Issues
1. Check PostgreSQL server status
2. Verify connection parameters in `.env` file
3. Ensure network connectivity
4. Check user permissions
Extension Errors
1. Run `get_server_info` to check extension status
2. Install missing extensions:
CREATE EXTENSION pg_stat_statements;
   CREATE EXTENSION pg_stat_monitor;
3. Restart PostgreSQL if needed
Configuration Issues
1. "No data found" for function statistics: Check `track_functions` setting
SHOW track_functions; -- Should be 'pl' or 'all'Quick fix for managed services (AWS RDS, etc.):
ALTER SYSTEM SET track_functions = 'pl';
   SELECT pg_reload_conf();
2. Missing I/O timing data: Enable timing collection
SHOW track_io_timing; -- Should be 'on'Quick fix:
ALTER SYSTEM SET track_io_timing = 'on';
   SELECT pg_reload_conf();
3. Apply configuration changes:
Performance Issues
1. Use `limit` parameters to reduce result size
2. Run monitoring during off-peak hours
3. Check database load before running analysis
Version Compatibility Issues
> For more details, see the ## Tool Compatibility Matrix
1. Run compatibility check first:
# "Use get_server_info to check version and available features"2. Understanding feature availability:
3. If a tool shows "Not Available":
Development
Testing & Development
# Clone and setup for development
git clone https://github.com/call518/MCP-PostgreSQL-Ops.git
cd MCP-PostgreSQL-Ops
uv sync

# Test with MCP Inspector (loads .env automatically)
./run-mcp-inspector-local.sh

# Direct execution methods:
# 1. Using uv run (recommended for development)
uv run mcp-postgresql-ops --log-level DEBUG

# 2. Module execution (requires PYTHONPATH)
PYTHONPATH=src python -m mcp_postgresql_ops --log-level DEBUG

# 3. After installation
mcp-postgresql-ops --log-level DEBUG

# Test version compatibility (requires different PostgreSQL versions)
# Modify POSTGRES_HOST in .env to point to different versions
Running Tests
Two test suites are available:
| Suite | File | Requires Docker |
|---|---|---|
| Unit tests (version compatibility logic) | `tests/test_version_compat.py` | No |
| Integration tests (all tools × PG 12–18) | `tests/test_tools_integration.py` | Yes |
`uv run pytest` automatically starts the Docker test containers (PG 12–18), waits for them to be fully initialized, runs all tests, then tears everything down.
# Run all tests (unit + integration) — Docker is managed automatically
uv run pytest -v

# Unit tests only (no Docker needed)
uv run pytest tests/test_version_compat.py -v

# Integration tests only
uv run pytest tests/test_tools_integration.py -v
> Note: Docker must be running. The test stack uses ports 5412–5418 (PG 12–18).
Version Compatibility Testing
The MCP server automatically adapts to PostgreSQL versions 12-18. To test across versions:
1. Set up test databases: Different PostgreSQL versions (12, 14, 15, 16, 17, 18)
2. Run compatibility tests: Point to each version and verify tool behavior
3. Check feature detection: Ensure proper version detection and feature availability
4. Verify fallback behavior: Confirm graceful degradation on older versions
Security Notes
- All tools are read-only - no data modification capabilities
- Sensitive information (passwords) are masked in outputs
- No direct SQL execution - only predefined queries
- Follows principle of least privilege
Contributing
🤝 Got ideas? Found bugs? Want to add cool features?
We're always excited to welcome new contributors! Whether you're fixing a typo, adding a new monitoring tool, or improving documentation - every contribution makes this project better.
Ways to contribute:
- 🐛 Report issues or bugs
- 💡 Suggest new PostgreSQL monitoring features
- 📝 Improve documentation
- 🚀 Submit pull requests
- ⭐ Star the repo if you find it useful!
Pro tip: The codebase is designed to be super friendly for adding new tools. Check out the existing `@mcp.tool()` functions in `mcp_main.py`.
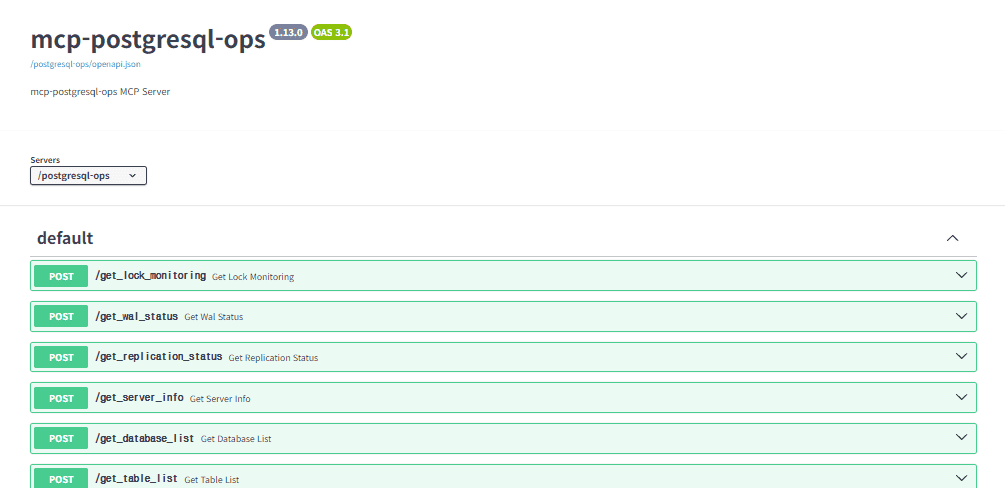
MCPO Swagger Docs
> [MCPO Swagger URL] http://localhost:8003/postgresql-ops/docs
🔐 Security & Authentication
Bearer Token Authentication
For `streamable-http` mode, this MCP server supports Bearer token authentication to secure remote access. This is especially important when running the server in production environments.
> Default Policy: `REMOTE_AUTH_ENABLE` defaults to `false` if undefined, null, or empty. This ensures backward compatibility and prevents startup errors when the variable is not set.
Configuration
Enable Authentication:
# In .env file
REMOTE_AUTH_ENABLE=true
REMOTE_SECRET_KEY=my-test-secret-key-12345
Or via CLI:
# Module method
python -m mcp_postgresql_ops --type streamable-http --auth-enable --secret-key my-test-secret-key-12345

# Script method
mcp-postgresql-ops --type streamable-http --auth-enable --secret-key my-test-secret-key-12345
Security Levels
1. stdio mode (Default): Local-only access, no authentication needed
2. streamable-http + REMOTE_AUTH_ENABLE=false: Remote access without authentication ⚠️ NOT RECOMMENDED for production
3. streamable-http + REMOTE_AUTH_ENABLE=true: Remote access with Bearer token authentication ✅ RECOMMENDED for production
Client Configuration
When authentication is enabled, MCP clients must include the Bearer token in the Authorization header:
{
  "mcpServers": {
    "mcp-postgresql-ops": {
      "type": "streamable-http",
      "url": "http://your-server:8000/mcp",
      "headers": {
        "Authorization": "Bearer my-test-secret-key-12345"
      }
    }
  }
}
Security Best Practices
- Always enable authentication when using streamable-http mode in production
- Use strong, randomly generated secret keys (32+ characters recommended)
- Use HTTPS when possible (configure reverse proxy with SSL/TLS)
- Restrict network access using firewalls or network policies
- Rotate secret keys regularly for enhanced security
- Monitor access logs for unauthorized access attempts
Error Handling
When authentication fails, the server returns:
- 401 Unauthorized for missing or invalid tokens
- Detailed error messages in JSON format for debugging
🚀 Adding Custom Tools
This MCP server is designed for easy extensibility. Follow these 4 simple steps to add your own custom tools:
Step-by-Step Guide
1. Add Helper Functions (Optional)
Add reusable data functions to `src/mcp_postgresql_ops/functions.py`:
async def get_your_custom_data(target_database: str = None, limit: int = 20) -> List[Dict[str, Any]]:
    """Your custom data retrieval function."""
    try:
        # Example implementation - adapt to your PostgreSQL needs
        query = """
        SELECT
            schemaname,
            tablename,
            attname as column_name,
            n_distinct,
            most_common_vals,
            most_common_freqs
        FROM pg_stats
        WHERE schemaname NOT IN ('information_schema', 'pg_catalog')
        ORDER BY schemaname, tablename, attname
        LIMIT $1
        """

        results = await execute_query(query, [limit], database=target_database)
        return results

    except Exception as e:
        logger.error(f"Failed to get custom data: {e}")
        raise
2. Create Your MCP Tool
Add your tool function to `src/mcp_postgresql_ops/mcp_main.py`:
@mcp.tool()
async def get_your_custom_analysis(limit: int = 50, database_name: Optional[str] = None) -> str:
    """
    [Tool Purpose]: Brief description of what your tool does

    [Exact Functionality]:
    - Feature 1: Data aggregation and analysis
    - Feature 2: Database monitoring and insights
    - Feature 3: Performance metrics and reporting

    [Required Use Cases]:
    - When user asks "your specific analysis request"
    - Your PostgreSQL-specific monitoring needs

    Args:
        limit: Maximum results (1-100)
        database_name: Target database name (optional, uses default if not specified)

    Returns:
        Formatted analysis results
    """
    try:
        # Always validate input limits
        limit = max(1, min(limit, 100))

        # Get your custom data
        results = await get_your_custom_data(target_database=database_name, limit=limit)

        if not results:
            return "No data found for custom analysis."

        # Format and return results
        return format_table_data(results, f"Custom Analysis Results (Top {len(results)})")

    except Exception as e:
        logger.error(f"Failed to get custom analysis: {e}")
        return f"Error: {str(e)}"
3. Update Imports
Add your helper function to the imports section in `src/mcp_postgresql_ops/mcp_main.py` (around line 30):
from .functions import (
    execute_query,
    execute_single_query,
    format_table_data,
    format_bytes,
    format_duration,
    get_server_version,
    check_extension_exists,
    get_pg_stat_statements_data,
    get_pg_stat_monitor_data,
    sanitize_connection_info,
    read_prompt_template,
    parse_prompt_sections,
    get_current_database_name,
    POSTGRES_CONFIG,
    get_your_custom_data,  # Add your new function here
)
4. Update Prompt Template (Recommended)
Add your tool description to `src/mcp_postgresql_ops/prompt_template.md` for better natural language recognition:
### **Your Custom Analysis Tool**

### X. **get_your_custom_analysis**
**Purpose**: Brief description of what your tool does
**Usage**: "Show me your custom analysis" or "Get custom analysis for database_name"
**Features**: Data aggregation, database monitoring, performance metrics
**Optional**: `database_name` parameter for specific database analysis
**Limit**: Results limited to 1-100 records for performance
5. Test Your Tool
# Local testing with MCP Inspector
./run-mcp-inspector-local.sh

# Or test with Docker stack
docker-compose up -d
docker-compose logs -f mcp-server

# Test with natural language queries:
# "Show me your custom analysis"
# "Get custom analysis for ecommerce database"
# "Analyze custom data with limit 25"
Important Notes
- Multi-Database Support: All tools support the optional `database_name` parameter to target specific databases
- Input Validation: Always validate `limit` parameters with `max(1, min(limit, 100))`
- Error Handling: Return user-friendly error messages instead of raising exceptions
- Logging: Use `logger.error()` for debugging while returning clean error messages to users
- PostgreSQL Compatibility: Your custom queries should work across PostgreSQL 12-18
- Extension Dependencies: If your tool requires specific extensions, check availability with `check_extension_exists()`
Advanced Patterns
For version-aware queries or extension-dependent features, see existing tools like `get_pg_stat_statements_top_queries` for reference patterns.
That's it! Your custom tool is ready to use with natural language queries through any MCP client.
License
Freely use, modify, and distribute under the MIT License.
⭐ Other Projects
Other MCP servers by the same author:
Frequently asked questions
What is MCP-PostgreSQL-Ops?
MCP-PostgreSQL-Ops is 🐘 Give AI assistants full PostgreSQL DBA superpowers — 30+ tools for performance analysis, bloat detection, lock/deadlock monitoring, autovacuum & schema inspection. No extensions required. PG 12-18.
How do I install MCP-PostgreSQL-Ops?
Open the GitHub repository and follow its README. Most MCP servers are added to your client's MCP config, then called by your agent.
Is MCP-PostgreSQL-Ops open source?
Yes — it is hosted on GitHub at https://github.com/call518/MCP-PostgreSQL-Ops and has 161 stars.
Related MCP tools
 google_workspace_mcp
Control Gmail, Google Calendar, Docs, Sheets, Slides, Chat, Forms, Tasks, Search & Drive with AI - Comprehensive Google Workspace MCP Server & CLI Tool
 pg-aiguide
MCP server and Claude plugin for Postgres skills and documentation. Helps AI coding tools generate better PostgreSQL code.
 OpenOSINT
AI-powered OSINT agent with interactive REPL, MCP server, and CLI. 19 tools. Works with Claude, GPT-4, or local models. For authorized security research only.
 projectmem
Open-source coding agent memory. Records issues, attempts, fixes and decisions, then warns your agent before it repeats an approach that already failed. Native MCP server for Claude Code, Cursor, Antigravity and Codex. 100% local, no cloud, no telemetry. MIT.
 tuui
tuuiA desktop MCP client designed as a tool unitary utility integration, accelerating AI adoption through the Model Context Protocol (MCP) and enabling cross-vendor LLM API orchestration.
 gpt-researcher
An LLM agent that conducts deep research (local and web) on any given topic and generates a long report with citations. Built for the Model Context Protocol to
Run your own MCP server? See who uses it and what to fix.
Measure it with TrackMCP