
mcp-server-prometheus
MCP server for interacting with Prometheus
Documentation
mcp-server-prometheus
MCP server for interacting with Prometheus metrics and data.
This is a TypeScript-based MCP server that implements a Prometheus API interface. It provides a bridge between Claude and your Prometheus server through the Model Context Protocol (MCP).
Demo
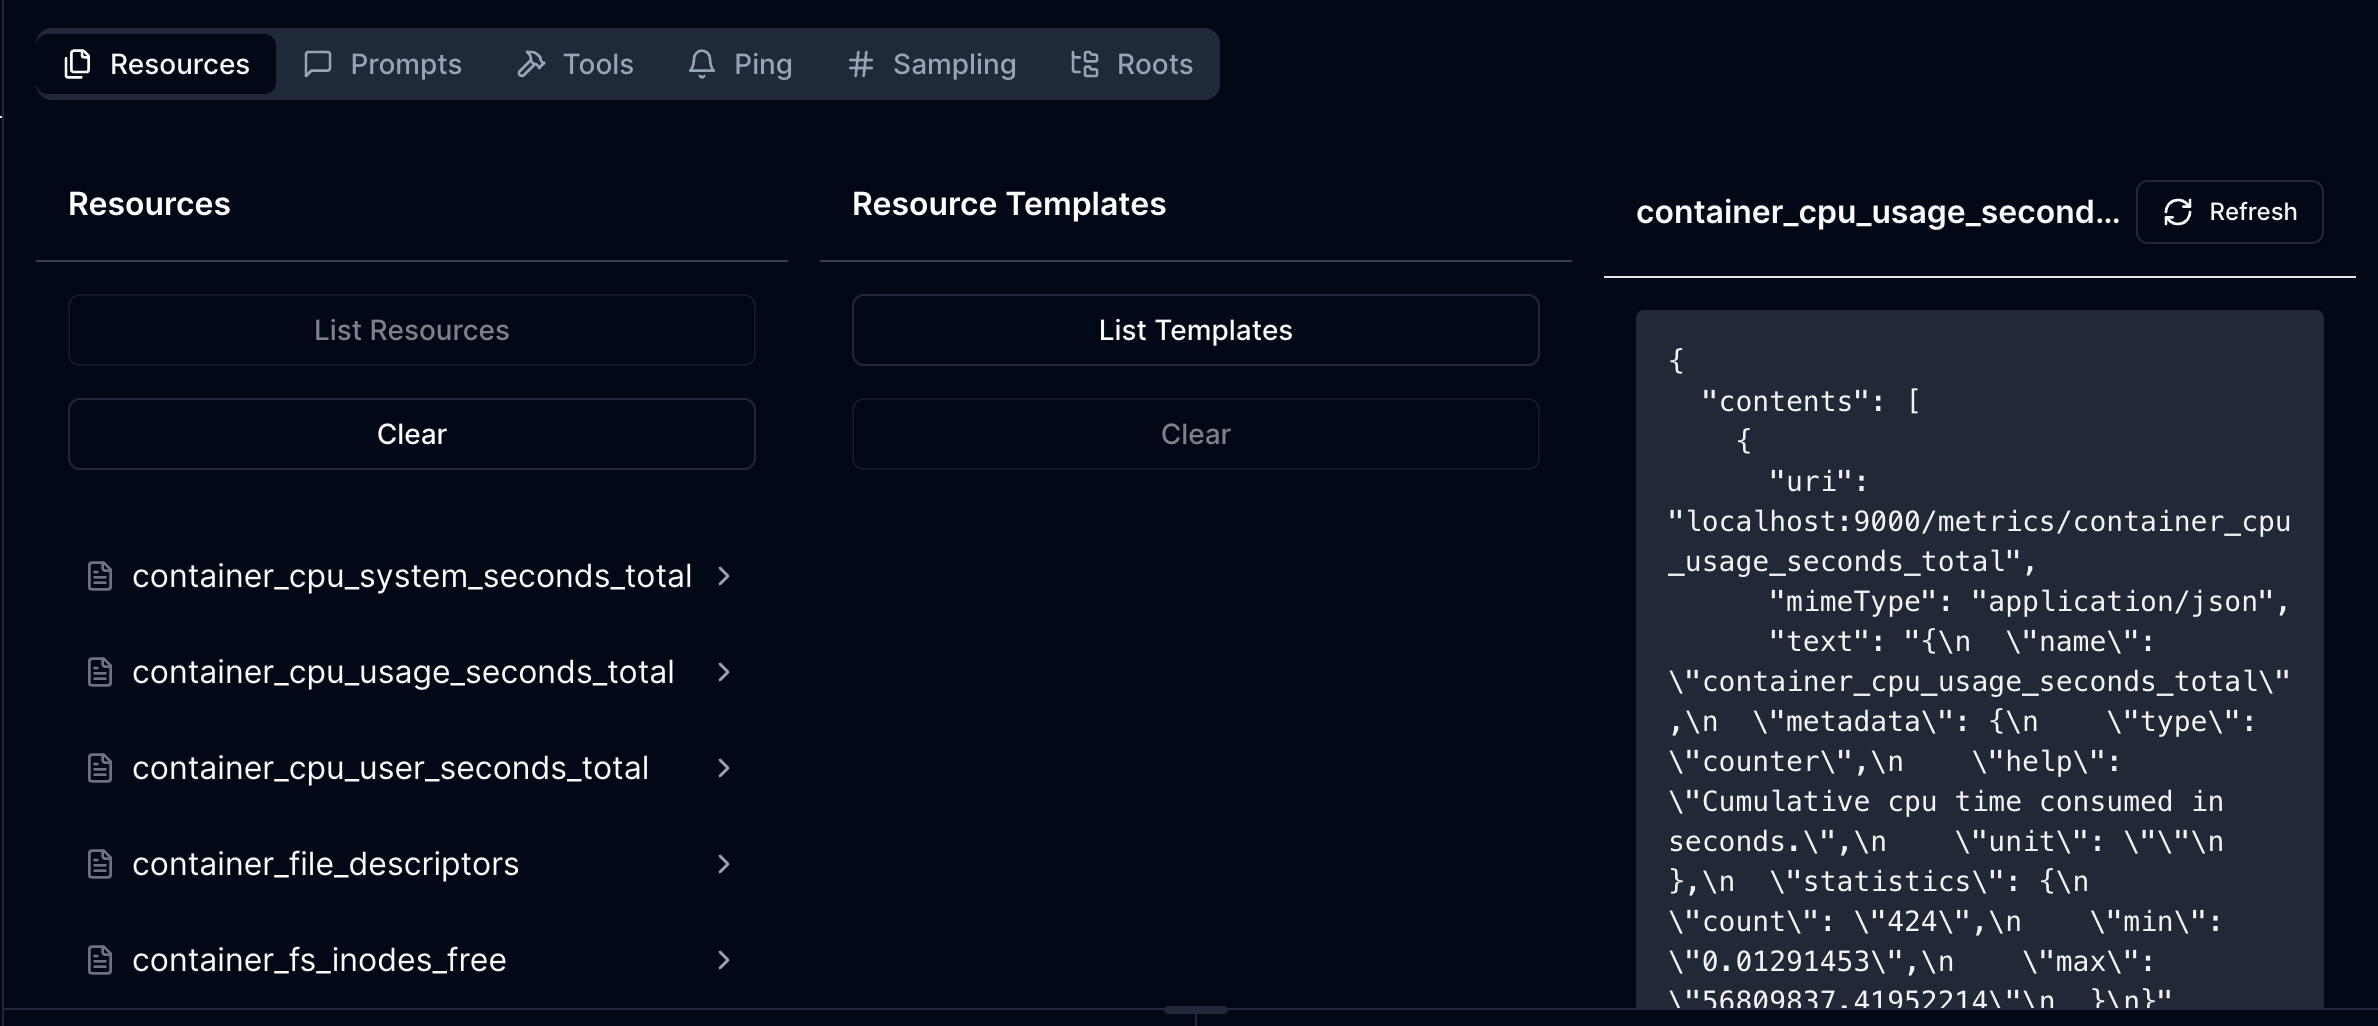
Features
Resources
- List and access Prometheus metric schema
- Each metric resource provides:
- Metric name and description
- Detailed metadata from Prometheus
- Statistical information (count, min, max)
- JSON mime type for structured data access
Current Capabilities
- List all available Prometheus metrics with descriptions
- Read detailed metric information including:
- Metadata and help text
- Current statistical data (count, min, max values)
- Basic authentication support for secured Prometheus instances
Configuration
The server requires the following environment variable:
- `PROMETHEUS_URL`: The base URL of your Prometheus instance
Optional authentication configuration:
- `PROMETHEUS_USERNAME`: Username for basic auth (if required)
- `PROMETHEUS_PASSWORD`: Password for basic auth (if required)
Development
Install dependencies:
npm installBuild the server:
npm run buildFor development with auto-rebuild:
npm run watchInstallation
To use with Claude Desktop, add the server config:
On MacOS: `~/Library/Application Support/Claude/claude_desktop_config.json`
On Windows: `%APPDATA%/Claude/claude_desktop_config.json`
{
  "mcpServers": {
    "mcp-server-prometheus": {
      "command": "/path/to/mcp-server-prometheus/build/index.js",
      "env": {
        "PROMETHEUS_URL": "http://your-prometheus-instance:9090"
      }
    }
  }
}
Debugging
Since MCP servers communicate over stdio, debugging can be challenging. We recommend using the MCP Inspector:
npm run inspectorThe Inspector will provide a URL to access debugging tools in your browser.
API Structure
The server exposes Prometheus metrics through the following URI structure:
- Base URI: `http://your-prometheus-instance:9090`
- Metric URIs: `http://your-prometheus-instance:9090/metrics/{metric_name}`
Each metric resource returns JSON data containing:
- Metric name
- Metadata (help text, type)
- Current statistics (count, min, max)
Frequently asked questions
What is mcp-server-prometheus?
mcp-server-prometheus is MCP server for interacting with Prometheus
How do I install mcp-server-prometheus?
Open the GitHub repository and follow its README. Most MCP servers are added to your client's MCP config, then called by your agent.
Is mcp-server-prometheus open source?
Yes — it is hosted on GitHub at https://github.com/loglmhq/mcp-server-prometheus and has 17 stars.
Related MCP tools
 firecrawl-mcp-server
🔥 Official Firecrawl MCP Server - Adds powerful web scraping and search to Cursor, Claude and any other LLM clients. JavaScript-based implementation.
 mcp-jetbrains
A model context protocol server to work with JetBrains IDEs: IntelliJ, PyCharm, WebStorm, etc. Also, works with Android Studio
 linear-mcp-server
A server that integrates Linear's project management system with the Model Context Protocol (MCP) to allow LLMs to interact with Linear.
 fastapi_mcp
Expose your FastAPI endpoints as Model Context Protocol (MCP) tools, with Auth! Python-based implementation. Trusted by 11000+ developers.
 ida-pro-mcp
AI-powered reverse engineering assistant that bridges IDA Pro with language models through MCP. Python-based implementation. Trusted by 4100+ developers.
 mcptools
A command-line interface for interacting with MCP (Model Context Protocol) servers using both stdio and HTTP transport. Go-based implementation.
Run your own MCP server? See who uses it and what to fix.
Measure it with TrackMCP